Financial
Sustainability
»
Tariff
Policy
KEGOC’s operations are governed by the Law of Kazakhstan on Natural Monopolies, according to which the services provided by KEGOC as the natural monopoly are as follows:
- electricity transmission in the NPG;
- technical dispatching of electricity supply and consumption in the grid;
- electricity generation and consumption balancing.
The Committee for Regulation of Natural Monopolies of the Ministry of National Economy of the Republic of Kazakhstan approved the tariffs, tariff estimates for regulated services of KEGOC for 2021-2026 (by order No. 79-OD dated 16 August 2021) effective 1 October 2021 to 30 September 2026 in the following rates:
| KZT/kWh | 01.10.2021-30.09.2022 | 01.10.2022-30.09.2023 | 01.10.2023-30.09.2024 | 01.10.2024-30.09.2025 | 01.10.2025-30.09.2026 |
| Electricity transmission in the power grid | 2.797 | 2.848 | 3.004 | 3.106 | 3.134 |
| Technical dispatching of the electricity supply and consumption in the grid | 0.306 | 0.314 | 0.333 | 0.348 | 0.355 |
| Management of electricity generation and consumption balancing | 0.098 | 0.102 | 0.105 | 0.108 | 0.110 |
Based on KEGOC’s application, the Committee on Regulation of Natural Monopolies of the Ministry of National Economy of the Republic of Kazakhstan (Order No. 130-OD dated 27 August 2022) approved the adjustment of tariff estimates for KEGOC’s regulated services for the first regulated period (from 1 October 2021 to 30 September 2022).
Meanwhile, the Committee for Regulation of Natural Monopolies of the Ministry of National Economy of the Republic of Kazakhstan (Order No. 67-OD dated 22 April 2022) approved the compensatory tariffs for regulated services of KEGOC effective 1 June 2022 to 31 May 2023.
KEGOC has challenged in court this decision of the Committee for Regulation of Natural Monopolies of the Ministry of National Economy of the Republic of Kazakhstan. In accordance with the provisions of the current legislation the order has been suspended for the duration of the trial.
Analysis of
Financial and Economic
Indicators
Plan vs Actual Analysis
| KZT mln | 2022 plan | 2022 actual | Deviation | Main reasons for deviations |
| Consolidated income | 245,042.9 | 227,027.3 | 92.6% | |
| operating income | 236,201.2 | 217,255.5 | 92.0% | Failure to fulfil the plan is mainly due to the decrease in:
|
| Consolidated expenses | 221,608.1 | 194,559.3 | 87.8% | |
| cost of sales | 195,712.7 | 166,355.9 | 85.0% | Decrease of 15.0% is mainly due to:
|
| general and administrative expenses | 9,552.6 | 9,020.4 | 94,4% | Decrease as a result of the existing savings on current expenses |
| selling expenses | 314,6 | 310,4 | 98.6% | Decrease as a result of the existing savings on current expenses |
| Operating profit |
30,621.3 | 37,993.9 | 124.1% | |
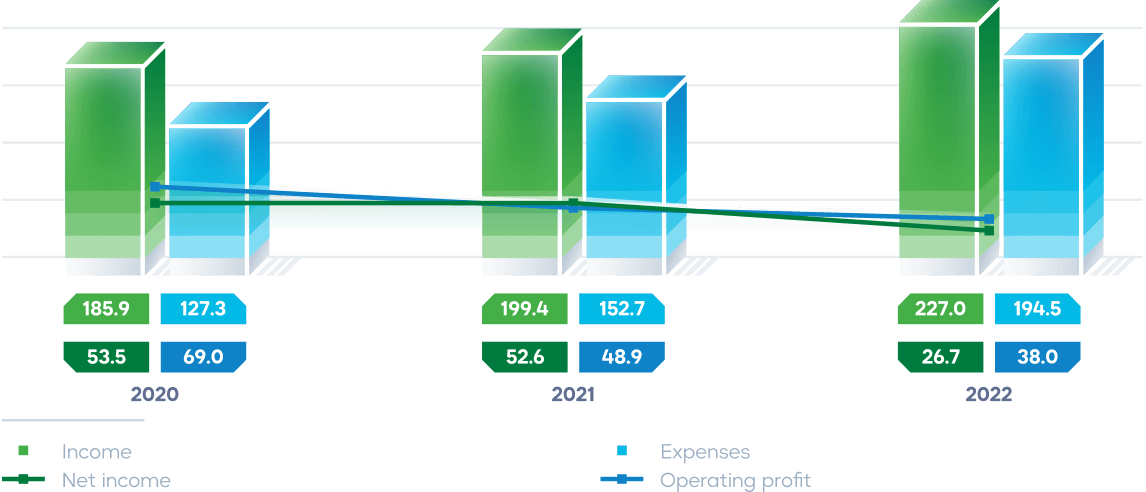
Analysis of actual income and expenses in 2022 vs 2021
| KZT mln | 2022 plan | 2022 actual | Deviation | Main reasons for deviations |
| Consolidated income | 199,424.1 | 227,027.3 | 113.8% | |
| operating income | 186,443.1 | 217,255.5 | 116.5% | Growth by 16.5% is mainly from income from regulated services by KZT 27,559.0 million resulted from the growth of tariffs and rendered volumes, as well as income from the sale of electricity to compensate hourly deviations of the actual interstate balance power flows by KZT 3,390.1 million. At the same time, the income decreased from sale of power control services by KZT 232.9 million. |
| КConsolidated expenses | 152,651.8 | 194,559.3 | 127.5% | |
| cost of sales | 120,682.9 | 166,355.9 | 137.8% | Growth by 37.8% is mainly due to the increase in depreciation expenses by KZT 24,399.9 million and property tax expenses by KZT 3,100.2 million as a result of fixed assets revaluation, payroll expenses with deductions by KZT 6,213.1 million, expenses for purchase of electricity to compensate for hourly deviations of the actual interstate balance power flow by KZT 6,236.7 million. |
| general and administrative expenses | 8,539.8 | 9,020.4 | 105.6% | Decrease as a result of the existing savings on current expenses |
| selling expenses | 381.2 | 310.4 | 81.4% | Decrease as a result of the existing savings on current expenses |
| Operating profit |
48,895.2 | 37,993.9 | 77.7% | |
Dynamics of financial and economic indicators
Ratio analysis
| Indicator | 2020 | 2021 | 2022 |
| ROACE, % | 9.48 | 7.7 | 4.2 |
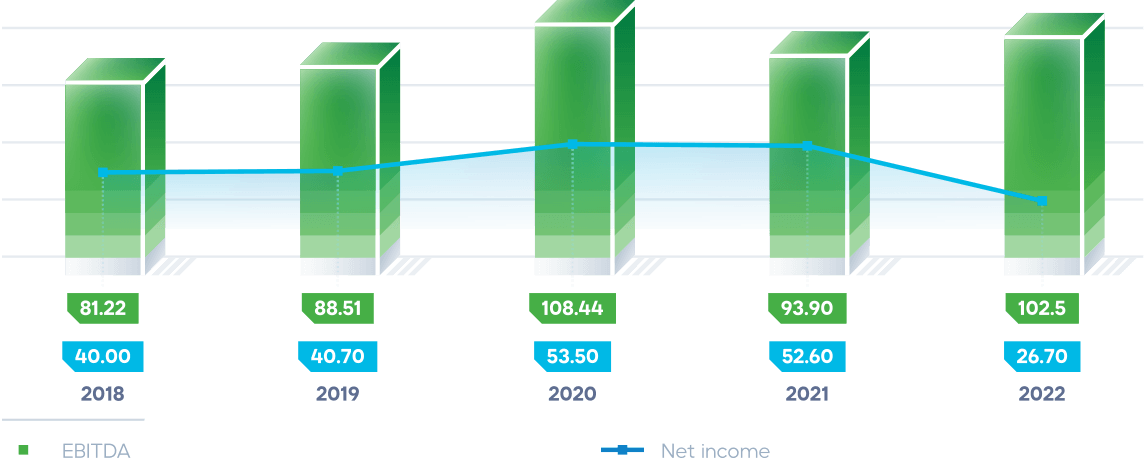
| EBITDA, KZT mln | 103,391.9 | 93,865.0 | 102,519.6 |
| Loan agreement covenants | |||
| Current liquidity ratio, not less than 1 | 1.69 | 1.61 | 1.89 |
| Covenants established by Samruk-Kazyna JSC | |||
| Debt/EBITDA, not more than 3.80 | 1.49 | 1.82 | 1.53 |
| Debt/Capital, not more than 1.40 | 0.32 | 0.23 | 0.24 |
During 2022, the established financial stability indicators and covenants were not violated.
Economic value
generated and distributed
Economic value distribution
| KZT mln | 2020* | 2021 | 2022 |
| Total capitalization | 663,590.51 | 908,336.27 | 809,916.87 |
|
502,556.47 | 737,136.82 | 653,565.16 |
|
161,034.04 | 171,199.45 | 156,351.70 |
| Funds from the government | - | - | - |
| Economic value generated | 185,852.94 | 199,424.10 | 227,003.95 |
|
179,097.56 | 186,443.14 | 217,255.55 |
|
5,480.24 | 5,368.22 | 5,726.12 |
|
1,275.13 | 7,612.74 | 4,022.29 |
| Economic value distributed: | 170,101.47 | 201,789.23 | 217,270.65 |
|
21,101.73 | 23,672.49 | 26,755.43 |
|
21,334.15 | 14,047.26 | 18,026.52 |
|
43,952.81 | 53,200.01 | 30,309.24 |
|
- | - | - |
|
77,761.28 | 99,492.06 | 136,625.19 |
|
5,951.50 | 11,377.43 | 5,554.26 |
| Profit after tax for the year from discontinued operations | 4,967.04 | 13,471.47 | - |
| Economic value of distribution | 20,718.50 | 11,106.33 | 9,733.30 |
* recalculated with the FSC RES alienation taken into
Balance analysis
| Indicator, KZT mln | 2018 | 2019 | 2020 | 2021 | 2022 | 2022/2021 |
| Non-current assets | 698,081.7 | 659,175.9 | 695,192.5 | 1,019,820.4 | 873,932.8 | -14.3% |
| Current assets | 57,769.0 | 97,111.0 | 116,820.1 | 73,396.9 | 112,679.4 | 53.5% |
| Total assets | 755,850.7 | 756,987.7 | 812,012.6 | 1,093,217.3 | 986,612.2 | -9.8% |
| Equity | 472,693.8 | 481,838.0 | 502,556.5 | 737,136.8 | 653,565.2 | -11.3% |
| Non-current liabilities | 236,958.6 | 230,808.2 | 239,766.9 | 310,396.6 | 273,569.6 | -11.9% |
| Current liabilities | 46,198.3 | 44,341.5 | 69,689.2 | 45,683.9 | 59,477.4 | 30.2% |
| Total liabilities | 283,156.9 | 275,149.7 | 309,456.1 | 356,080.5 | 333,047.0 | -6.5% |
| Total equity and liabilities | 755,850.7 | 756,987.7 | 812,012.6 | 1,093,217.3 | 986,612.2 | -9.8% |
Goal 3 Achievement Indicators
| Name of KPI | 2018 actual | 2019 actual | 2020 actual | 2021 actual | 2022 plan* | 2022 actual |
| EBITDA, KZT bln | 81.2 | 88.5 | 108.4 | 93.9 | 96.4 | 102.5 |
| TSR (total shareholder return),% | indicators defined in December 2021 | 3.8 | -10.7 | |||
* the planned values set by Business Plan for 2022-2026
Profitability